Judgement leads: strategy is defined with the client, drawing on decades of experience of which technologies succeed in which applications, and why. Custom techno-economic models then underpin it, built from real operational data: first-principles physics and chemistry plus economics.
How we work
From immersion to implementation
1
Understand
Immerse in the operation (its data, duty cycles, constraints, stakeholders and objectives) and capture the agreed cause-and-effect picture in a Decision Map.
2
Model
Build a custom Excel and Python techno-economic model from real operational data: first-principles physics and chemistry plus economics.
3
Analyse
Expose the value drivers: sensitivities, platform comparisons, infrastructure trade-offs and risks.
4
Decide
Define the lowest-cost, highest-performance pathway, and the staging, capital plan and trade-offs the decision turns on.
5
Deliver
Support implementation: business cases, prototypes, OEM engagement and executive alignment.
Experience, systematised. Much of what decides these calls never appears in a vendor datasheet: how technologies behave at scale, where ramp-ups stall, which risks kill projects in execution rather than on paper. Our methodology exists to bring that experience to bear systematically: structured risk identification, technology-maturity benchmarking and ramp-up analysis, so the judgement is explicit and testable, not a gut call.
A signature first-phase deliverable, the Decision Map. Many engagements begin with a solution already in mind that turns out to solve the wrong problem. The Decision Map is our name for a causal map, and, where feedback loops dominate, a causal loop diagram (CLD): the established systems-thinking technique that gets your team's tacit knowledge onto one page, so everyone agrees what drives what before any modelling begins. Quick to build, and a hallmark of how we work: it gives your internal champion something clear to rally the organisation around. See two worked examples at the bottom of this page.
The result: decisions that survive scrutiny, because the economics, the engineering and the operations were modelled together, not assumed.
The pipeline scales to the decision. Sometimes that's a two-week screening study, enough to triage the options and tell you which are worth pursuing; sometimes a month-long evaluation; sometimes a multi-year program through to prototype and capital plan. We will work with you to scale the analysis to the right problem.
Screen → evaluate → model
We model what matters, not everything
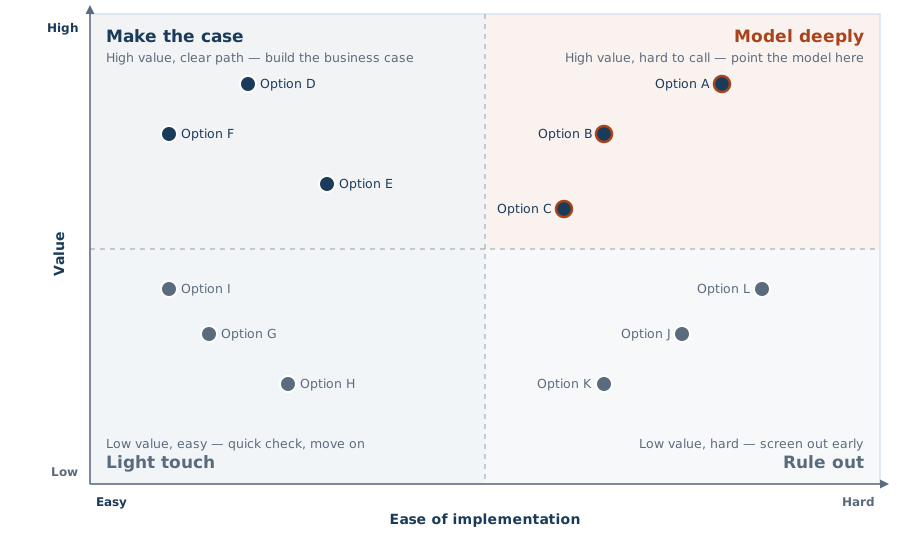
A rapid screening and evaluation layer shortlists the options worth the deep analysis. Value-Ease screening and technical-maturity / feasibility optioneering triage the field; the survivors are then deep-modelled: total cost of ownership across corridors for a decarbonisation decision, or recovery, net present value and ramp-up risk for a processing or investment decision.
Screen & evaluate
Value-Ease screening and structured technical-maturity, feasibility and optioneering assessment, for example, what technology can realistically fit a platform, and how that changes as the technology matures.
Deep-model the survivors
Energy analysis, platform development, full total cost of ownership modelling and fleet-wide scenario analysis, the quantitative core that turns a shortlist into an investment-grade pathway.
Illustrative Value-Ease screen: every candidate option is scored on value and on ease of implementation, then triaged. The high-value options that are hard to call (Model deeply) are where the detailed techno-economic model earns its keep; the rest are made-the-case, light-touch or ruled out without burning analysis on them. Points are illustrative, not drawn from any client engagement.
Signature method
Detailed techno-economic modelling
At the core of every engagement is a custom techno-economic model (first-principles physics, chemistry and engineering coupled to the full economics) that lets you compare every viable option on a like-for-like basis, across the operation and over time, and see which one wins, by how much, and when.
What it gives you: the value drivers laid bare: the assumptions that matter, the sensitivities that move the answer, and a clear, costed pathway you can defend to a board. The same approach evaluates a fleet's route to net zero or the economics of a processing technology or project; only the metrics change: total cost of ownership and carbon for decarbonisation, or recovery, throughput, net present value and ramp-up risk for minerals processing.
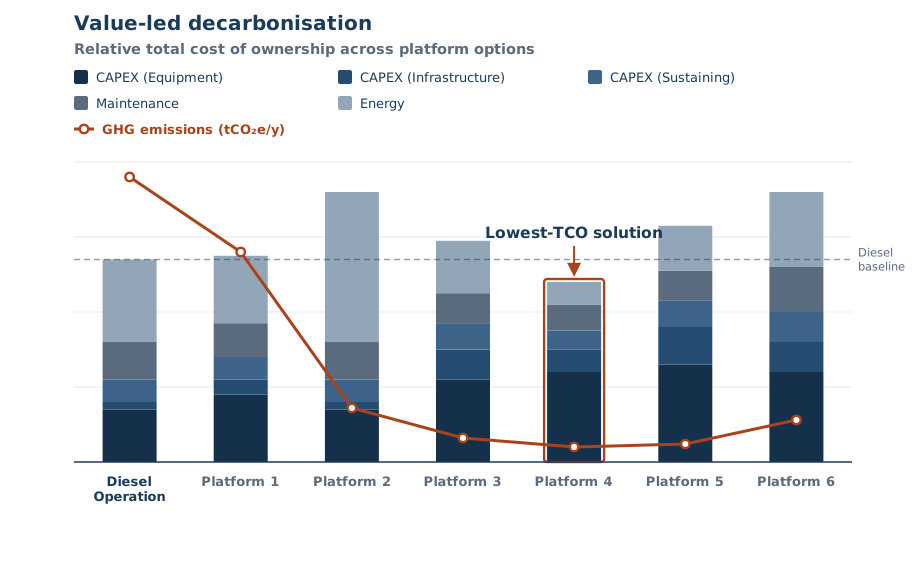
Illustrative output for a given haul: every viable platform compared on a like-for-like total-cost-of-ownership basis, with the full cost stack broken out and greenhouse-gas emissions overlaid. The model surfaces the lowest-cost option and what drives it; here, the cheapest pathway is also among the lowest-emitting. The result is haul-specific: for a longer or shorter haul, with different energy demand and conditions, the lowest-TCO solution may change, which is why we model each one on its own. Figures are indicative, not drawn from any client engagement.
We model where the technology is heading, not just where it is today. With new technologies (batteries especially), performance and cost are changing significantly over time. We model that change from deep industry knowledge to understand when a technology will be good enough. You don't want to base a strategic decision on today's technology when a better solution will arrive in five or ten years, so planning for that becomes part of the strategy itself.
The model we build for your decision is yours to keep: auditable, transferable at the end of the engagement and maintainable as things progress.
Worked examples
The Decision Map in practice
A Decision Map turns a team's tacit knowledge into one shared causal picture that often surfaces a counter-intuitive lever the obvious symptom hides. Two examples from different industries: one a causal map, one a causal loop diagram.
1. Heavy-haul rail: the battery-sizing trap
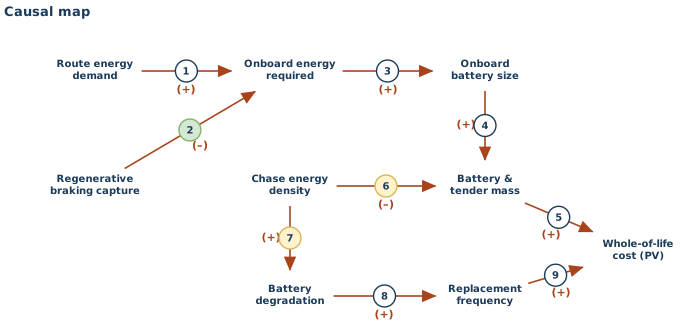
Why does chasing energy density push up whole-of-life cost?
Each arrow is a causal link; (+) means the two variables move the same way and (–) means they move in opposite directions. Read left to right, everything converges on whole-of-life cost; green is the leverage, amber the seductive-but-wrong fix.
The leverage isn't a denser battery. It's capturing regenerative braking (about a third of the energy, recovered with a small battery and no new infrastructure) and sizing on whole-of-life cost with a durable chemistry, rather than optimising the one number that happens to be visible on the spec sheet.
A locomotive can only carry so much energy, and because freight operators rarely own the land at mines and ports for charging infrastructure, almost all of a route's energy needs to be carried onboard. Capturing regenerative braking cuts what must be carried (around a third of it, depending on the haul), and the rest sets the onboard battery size, within a fixed mass and volume budget. Going beyond that mass/volume budget requires battery tenders, but adding them reduces the payload the train can carry, increasing whole-of-life cost.
The obvious way to fit more energy into the same mass is to chase energy density. But currently the densest chemistries tend to degrade fastest, so they need replacing more often, and over a 20-year life that makes the densest battery the most expensive. In this study the lower-density but durable and low-cost LFP chemistry wins on present-value cost across almost every corridor. Mass is visible at design time; whole-of-life cost is not, so the wrong number ends up driving the decision.
Reference: Knibbe, R., Harding, D.*, Cooper, E., Burton, J.*, Liu, S., Amirzadeh, Z., Buckley, R.* & Meehan, P.A. (2022). Application and limitations of batteries and hydrogen in heavy haul rail using Australian case studies. Journal of Energy Storage, 56, 105813.
* HIC team
2. Mine haul roads: the dust–water death spiral
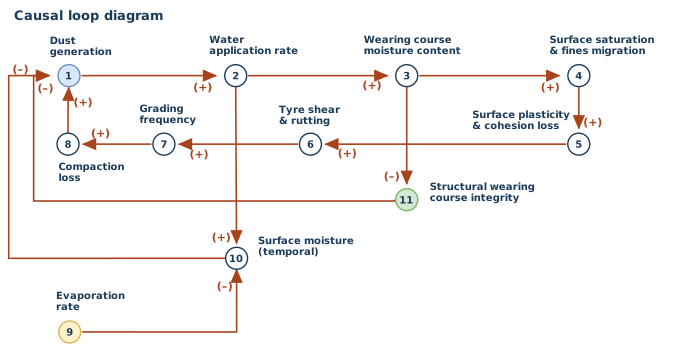
Why does watering a dusty road more often eventually make the dust worse?
Each arrow is a causal link, numbered for reference; (+) means the two variables move the same way and (–) means they move in opposite directions. Follow the arrows and the loop feeds itself: a self-reinforcing, vicious cycle.
The leverage point isn't more frequent watering. It's shifting from reactive dust suppression to programmed moisture management: holding the wearing course within its structural optimum and tracking grading frequency, not dust levels, as the clearest signal that the loop is running away. Mapping the system first is what surfaces a lever like this; managing the obvious symptom never would.
A haul road's wearing course only suppresses dust well within a narrow moisture band, close to the Proctor optimum for the material. Below that band the surface is dry and friable; above it the surface turns plastic, and that is the trap. Water a road above its optimum and the suppression lasts perhaps 20–60 minutes in arid conditions before evaporation returns it to dustiness, but the moisture has already done its damage underneath: fines wash out of the compacted matrix, cohesion breaks down, and the next loaded haul truck shears the softened surface into ruts and corrugations rather than rolling cleanly across it.
When the rutting gets bad enough, the road is graded, and grading is where the trap closes. A graded road looks better immediately, but grading strips away the compacted layer entirely, leaving a road structurally weaker than the one it replaced. Each cycle leaves the road worse than the last: grading frequency climbs even as condition declines, and a degraded, uncompacted surface generates more dust than the one the water was meant to fix.
The loop persists, even on sites that know about it, because of what's visible and what isn't. Dust is immediate and obvious, and often the only thing being managed. Wearing-course integrity, the variable that actually determines whether the road holds up, has no dashboard: the operator sees suppression working in real time, and with a penalty for under-watering and none for over-watering, behaviour is driven one way. Nobody sees the compaction loss accumulating underneath until the grading bill or the rutting becomes impossible to ignore, by which point accountability cannot be attributed.
Reference: Thompson, R., Peroni, R. & Visser, A. (2019). Mining Haul Roads: Theory and Practice. CRC Press, Taylor & Francis. Supporting: Thompson, R.J. & Visser, A.T. (2006), Selection and maintenance of mine haul road wearing course materials, Mining Technology, 115(4).
Curious whether this fits your decision?
We'll walk you through the approach and where it adds the most value.